
Cycling time estimates
Estimate your cycling ride time.
Planning a weekend ride, gran fondo or long-distance route? Start with your route and power reference points. Compare moving time, average speed and arrival time for the effort and stops you choose.
- 01Start with a real routeImport a GPX, TCX or FIT file, or draw your route on the map.
- 02Describe your effortEnter your FTP, bike and, if you have one, your personal power curve.
- 03Compare three time estimatesCautious, likely and ambitious scenarios with moving time, average speed and elevation profile.
- 04Plan your stopsAdd stops to the ride plan to update waypoint and arrival times.
For every cycling plan
One time to plan, three ways to ride.
Distance divided by average speed misses climbs and stops. The estimate starts with your route and planned effort, then separates time on the bike from time stopped.

Estimate a cycling ride
Your weekend route has its own terrain. Compare a cautious pace with a harder one, then check whether your return time is realistic.

Plan a gran fondo
Estimate key waypoint and arrival times using the elevation profile, your power strategy and planned feed-stop times. Leave a margin for the event day.

Plan a long-distance ride
On an ultra-cycling route, stops matter as much as pace. Mark your stopping points and treat times as reference points, not guarantees.
Where does the estimate come from?
Your route meets your watts.
Working Out divides the route into segments, then estimates speed on each from the gradient, resistances and target power. You can inspect the assumptions instead of receiving an unexplained number.
Route and elevation
The GPX provides distance and elevation. Check the route and profile: incorrect elevation can change the estimate.
FTP and the power curve
Your functional threshold power (FTP) guides your strategy. An imported personal power-duration curve bounds planned efforts; otherwise, the simulator identifies its estimated curve.
Bike and conditions
Your weight, bike, position, rolling resistance and wind change the calculated speed. These settings remain visible and adjustable.
The full-day time
The result separates moving time from chosen stops. The displayed average is for riding; total time determines waypoint and arrival times.
Read the result, adjust the plan
Three scenarios. An arrival time to put in context.
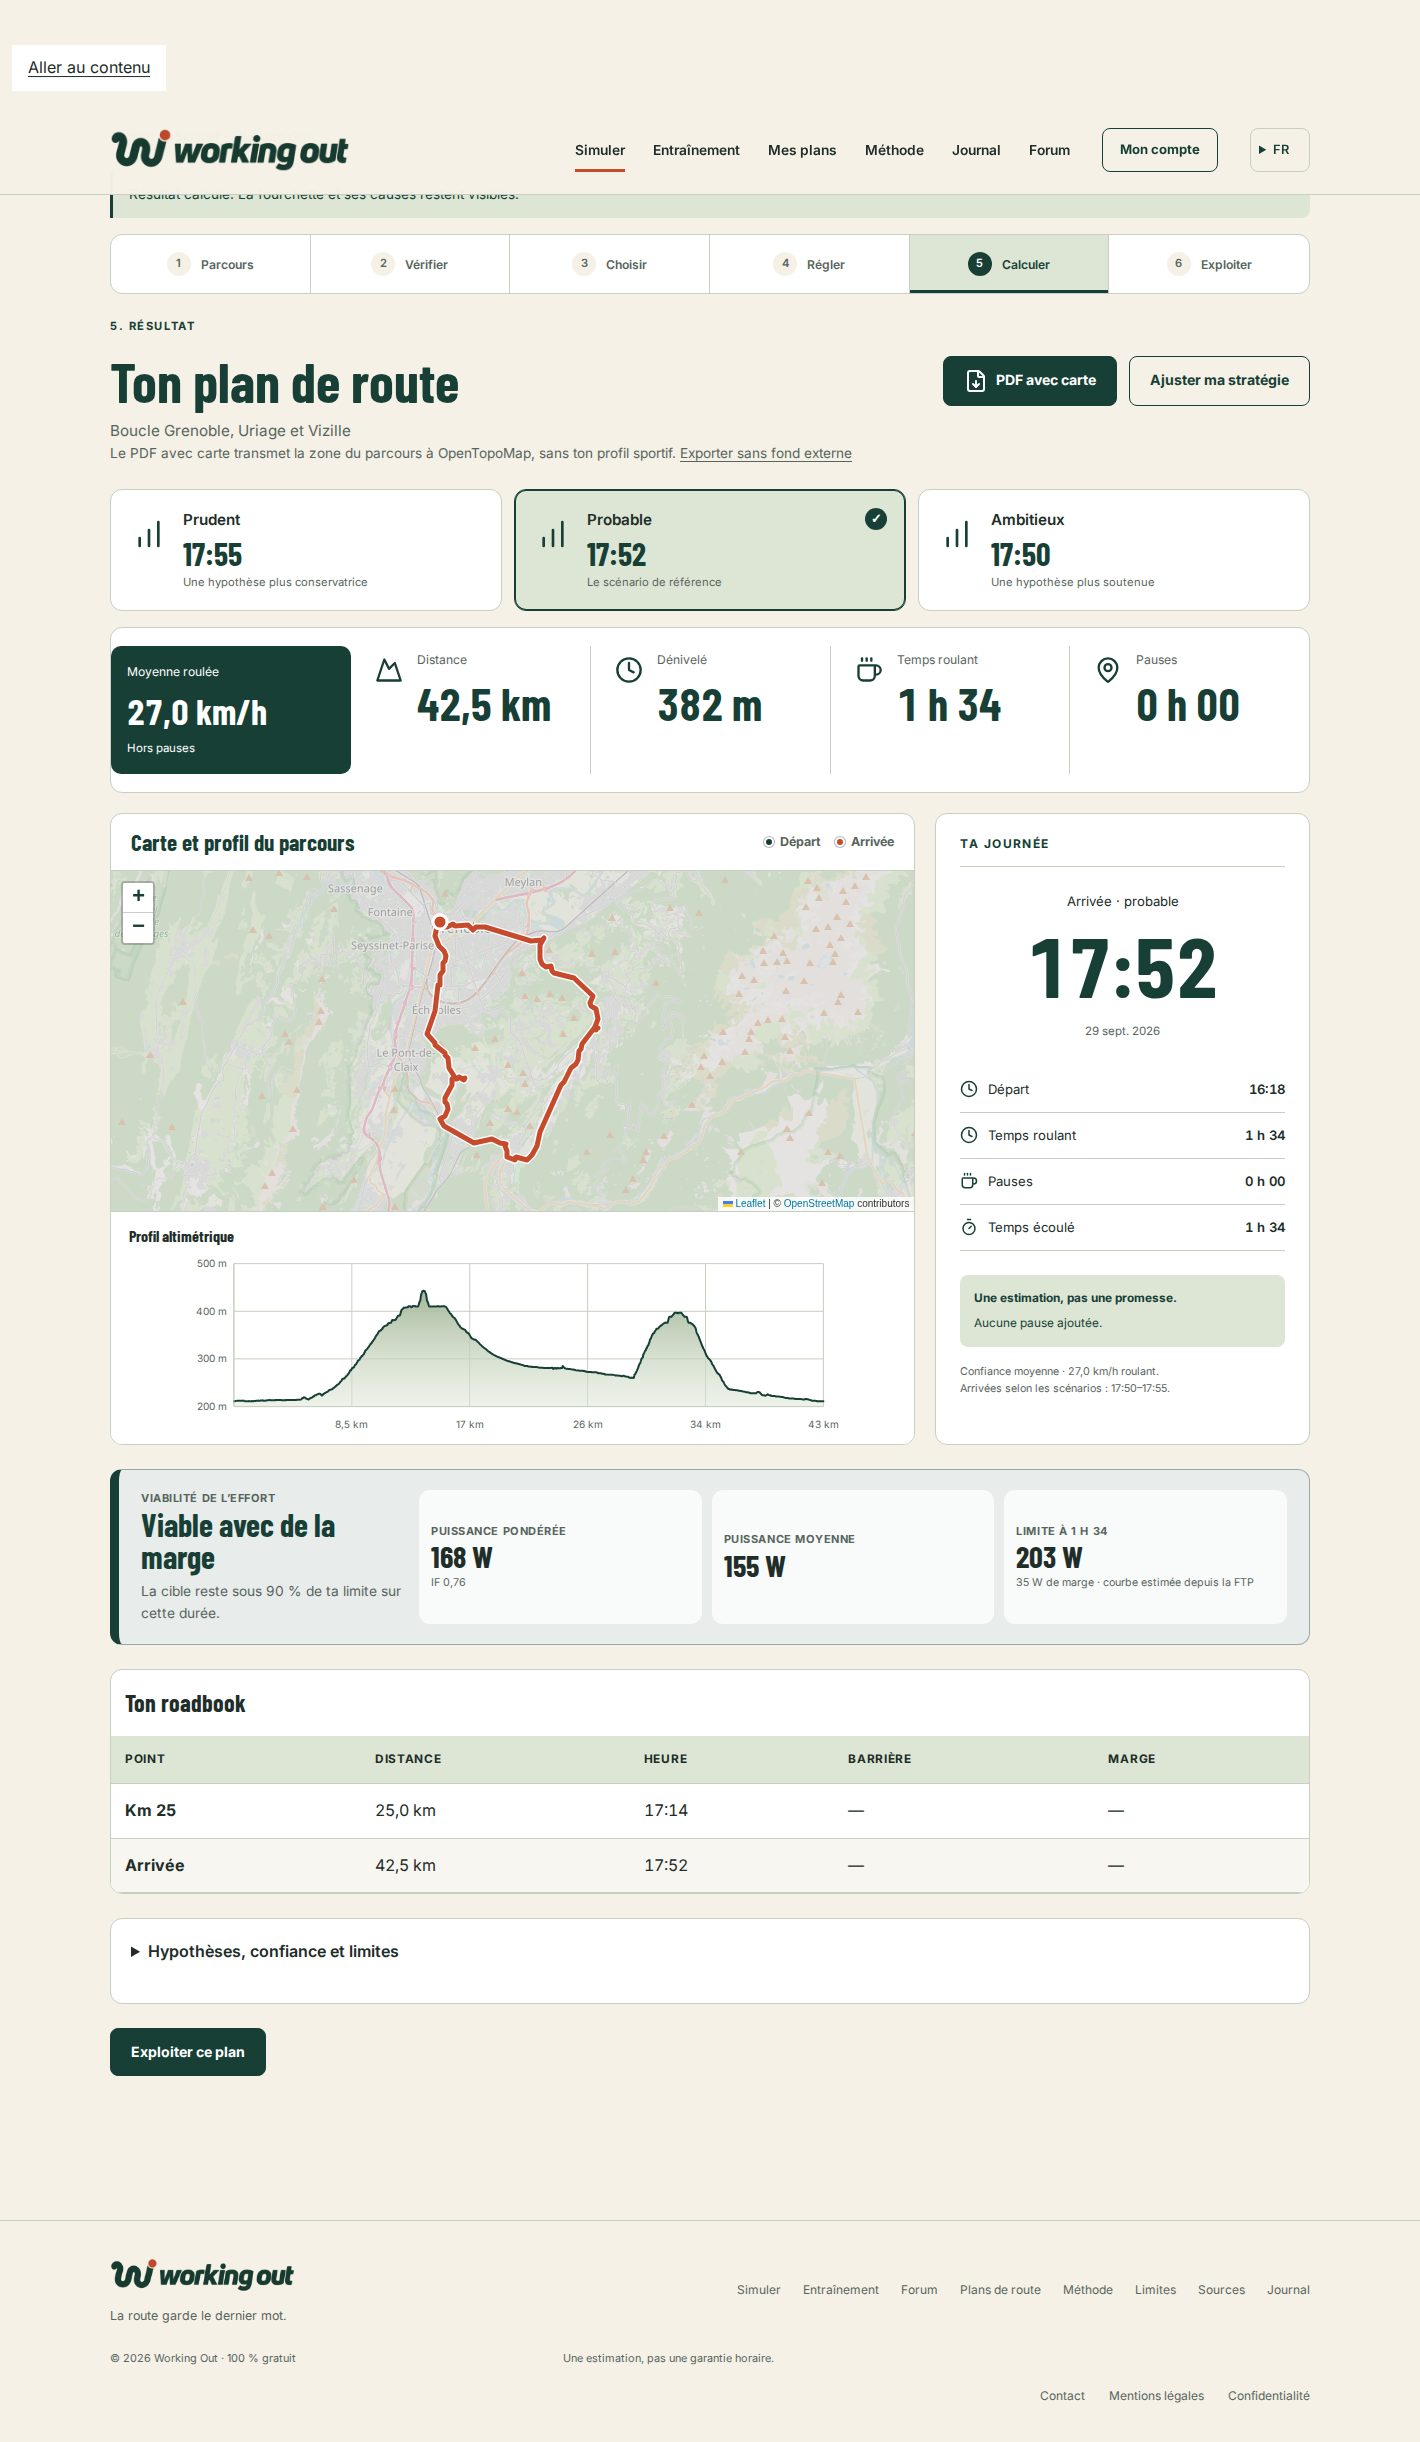
The cautious, likely and ambitious scenarios change the effort level. Compare moving times, average speeds and margins against your power curve. An overly demanding scenario is flagged: the fastest is not automatically the wisest.
Then add the stops you actually plan. The ride plan recalculates waypoint and arrival times without confusing a stop with slower riding. You can save the plan in your account and take a PDF with the map and profile.
See what the simulator cannot predictOnce your account is created
A few reference points and you can get started.
Add your FTP, weight and bike in your welcome space. Then you can import or draw a track and prepare your ride plan.
Ready for your next route?
Estimate your ride time for free.
Create your account, enter your starting details and import your route. No payment or card required.
Create my free account